So, it's kind of a Venn-Diagram, the ones you've had in school to visualize intersections and unions of sets...

Or more sophisticated, in the form of a contingency table, because the sample uses logical opposites, completing each other:

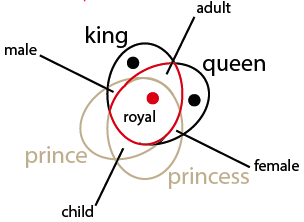
So again, visualized as sets (outline-color shows semantic extent, presupposed, there's no semantic intersection between male/child, child/female, female/adult, adult/male) we get the following:

(which is a simplified version of the first graphic of this post)
we can now deduce, step by step:
1. king - prince yields (keep in mind the "negative" child, indicated by inverse colors!):

2. (king - prince) + princess yields (notice how the "negative" child from result of step 1 and "positive" child from definition of princess, cancel each other out!):

which (by definition) happens to equal queen !!!
q.e.d.